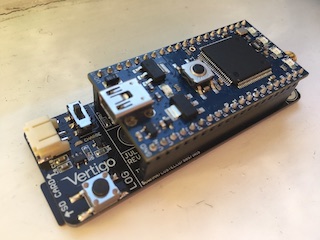
Instructions and troubleshooting for the VertigoIMU inertial datalogger.
Born
to Engineer films from the ERAF
![]()
September 2018
A new type of analysis
There’s been a bit of a hiatus in my Vertigo activities of late due to unexpected changes to my role at school. I am back now, and very keen to pick-up where I left off, getting more students enjoying the opportunities the Vertigo project has to offer.
We’ve received some additional support from the ERAF and we’re aiming to have 20 more Vertigo units out in schools by the middle of next year. More on those units to come.
For now, I offer a different type of analysis that may be of interest.
Fiddling around with a Vertigo IMU, I decided to see if I could use matlab to give me a Fourier Transform of its repetitive movements.
The results were fascinating.
First up.
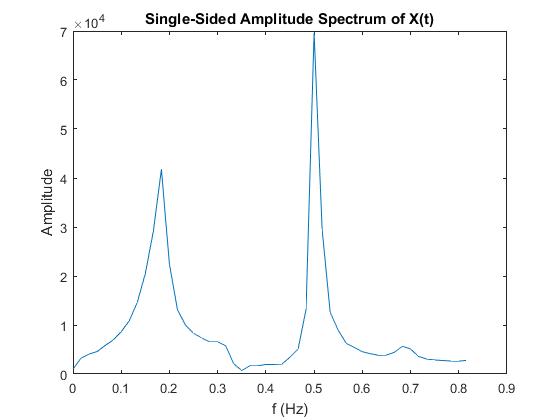
This graph shows the frequency of a ‘Seconds Pendulum’ I fashioned in my kitchen. This is a classic pendulum with a time period of 2 seconds (one second each half swing) and hence a frequency of 0.5Hz.
Note the good-looking peak around the required frequency- perfect! But what’s the odd-looking bulge around 0.2Hz?
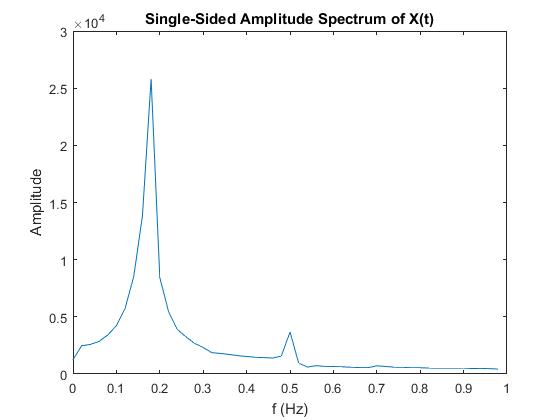
After a little consideration, I realised that the pendulum would also be oscillating around its vertical axis; it would be a torsional pendulum too. In my second experiment, I did my best to set the system off with this type of motion only.

Hey presto- the analysis confirmed my initial thoughts. There was now a far more dominant peak at 0.2Hz the frequency of the torsional oscillations, with a tiny bit of the Seconds Pendulum remaining.
Chuffed with these results, I set off for some real science. I took Vertigo for a walk.
Here is what I found:
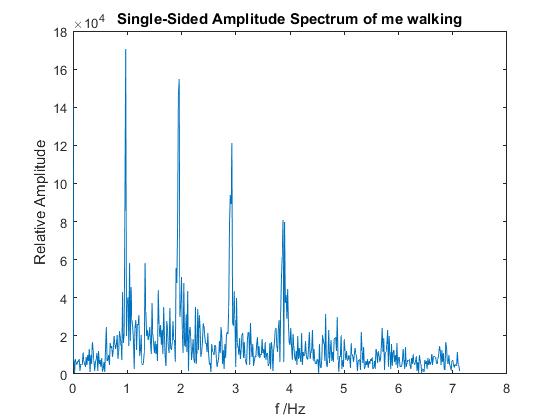
There’s a dominant frequency of around 1Hz. Given that my typical stride is just under 2m this gives me a walking speed of around:
V = f λ
V = 1Hz x 2m
V = 2m/s
That’s about 4 miles/ hour
A value confirmed with Vertigo’s other analysis features.
But the graph has posed more questions than it has answered and, as ever with IRIS projects, the answer is not in the back of a book.
So:
- What do the other frequencies relate to?
- Does everyone have the same frequency profile?
- Do different parts of the body oscillate in a similar way?
- What happens if I run?
There’s so much scope for investigation here. Or, of course, you don’t need to measure a human’s gait. I doubt Vertigo has ever been done on a sloth, for example.

If you would like to try this type of analysis, the matlab script is here. Load data into matlab in the normal way and then run this analysis.
February 2018
Vertigo is out in schools!
Time flies. Since the last up-date there have been several steps forward in project Vertigo.
-
The software has been updated and now incorporates a Kalman filter in 3D
-
A new Vertigo blog has been started
-
The kits have arrived in ten schools across the country
I’ll start with the 3D kalman.
This is big improvement to the position estimate for Vertigo and allows the user to weight the relevant importance of the GPS or accelerometer data.
In lines 34 and 35 of the kalman 3D matlab script. We can assign a variance to each of the GPS or IMU inputs.
gps_var = 1e-6;
imu_var = 1e-3;
A larger variance means that the data is less reliable and the position estimate relies less on this data. Optimising the position output is probably a project in itself… but it is good fun playing around with these values. The new scripts are here
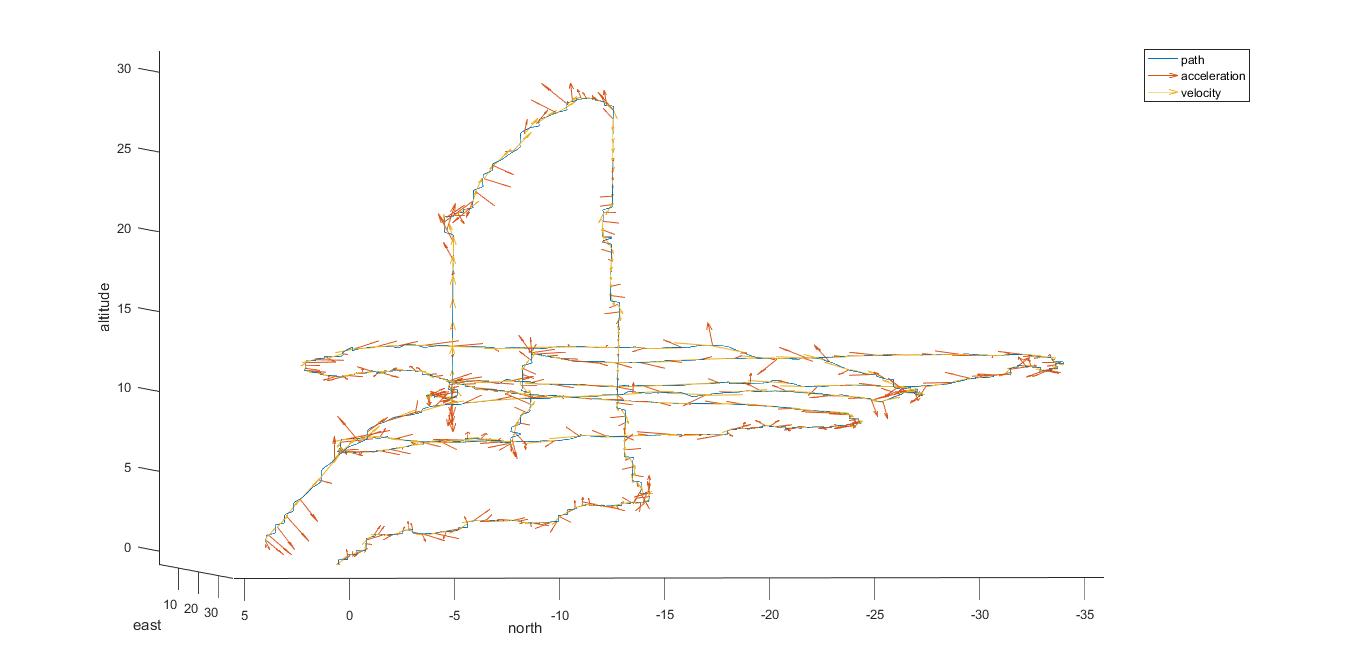
Using the 3D filter, my team recorded data for a drone flight at our school’s playing fields. Here’s a plot of position with accelerations and velocity vectors added.
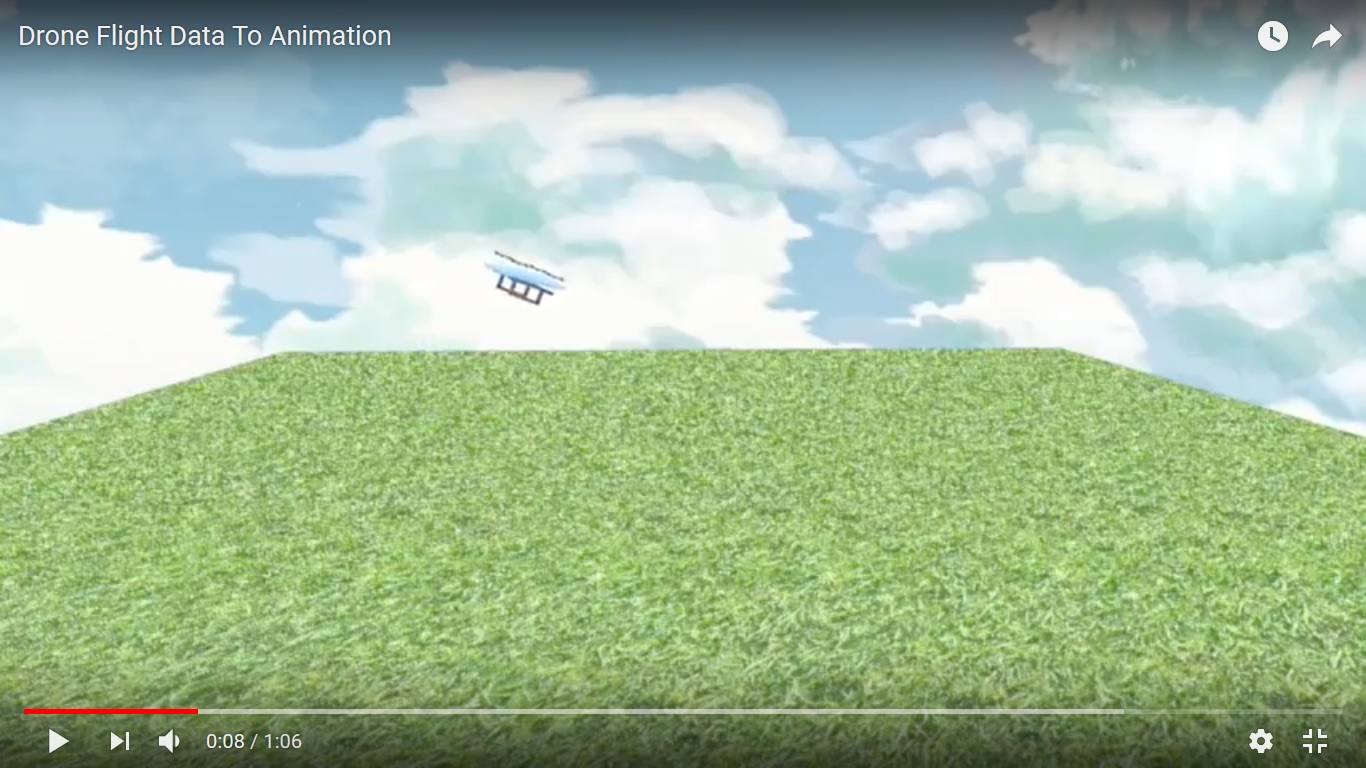
In addition, one of the team decided to recreated the flight in a silicone world. I love this. Real data, a significant challenge and brilliant learning- that’s what Vertigo’s all about. Click the picture to see the full ainimation.
Mr Crawford’s blog!
There’s another Vertigo blog. Mr Crawford has been recording his school’s use of the device and the activities they have been performing. Here’s a link: Mr Crawford’s blog
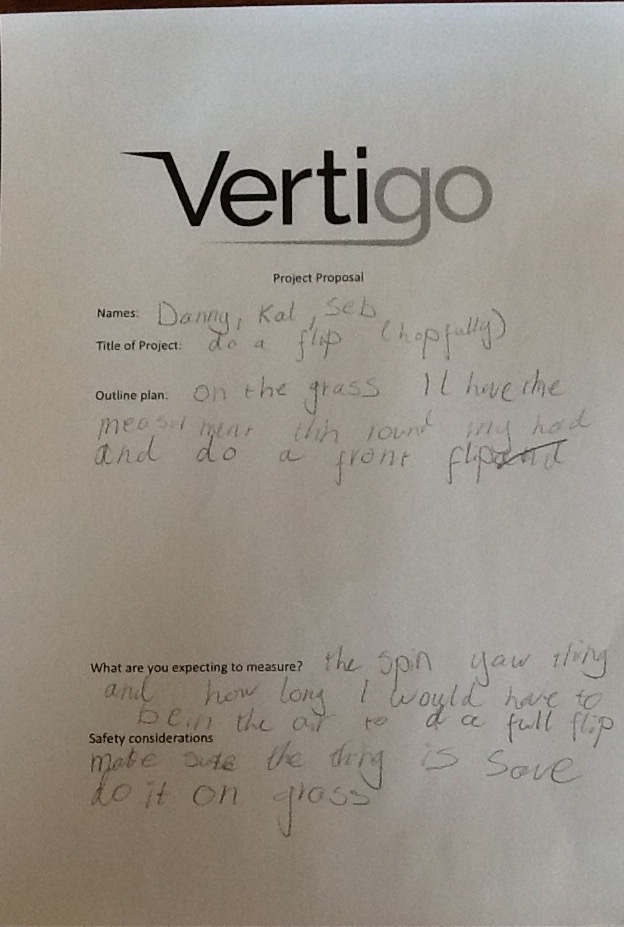
My personal favourite part to date is the project proposal set out by a couple of his pupils. Good luck team- hopes it all works out well. Can’t wait to see the outcomes.
And finally, Vertigo is now out in schools across the country. I am hoping we’ll be seeing some results from these schools soon.
December 2017
Removing position estimate drift
Example of position estimate drift
Little has happened throughout the Chritmas period and so I take the opportunity to describe how to perform some more advanced data analysis.
Students studying any of the sciences at A-level will be familiar with the terms uncertainty and accuracy. Uncertainty, is affected by experimental noise; a measure of the spread of data around an average value, which is hopefully, an accurate one. Like all electronic devices, Vertigo suffers from noise.
Accelerometers have a healthy dose of it. In itself, this is not too damaging to our goals of finding position because we can find an average and move on (no pun intended). But, the manner with which we find position from acceleration introduces a whole new set of circumstances.
The most notable being rounding error and global truncation error.
The first is a problem occasionally encountered in an A-Level Physics lab. There, we generally get the data and do the sums. By and large, we get them right. But there is one situation that may resonate with student readers – the times when, a value is calculated, the answer quoted and then this is fed this back into a subsequent question. Should you use the rounded value or the 10 digit value held in your calculator? Which one does the examiner want? Imagine then, that Vertigo analysis performs this balancing act 200 times per second. You’ll already have gathered, after a minute or so, our answer for Vertigo’s position could be way off reality.
Global truncation error is an additional source of drift borne out of the Euler method for solving differential equations by iterative steps (exactly what Vertigo does). We have to assume that, during a time between sampling data, the acceleration of Vertigo is constant. It may not be. But this data is used to predict where Vertigo will be before the acceleration measurement is updated and the calculation rerun. This is never going to be perfect. Add in the concept that noise means that the acceleration we record may not in fact be the true value and we have a good recipe for position estimation drift. It is all fairly challenging.
To make our approximation better, Vertigo uses a fast sample rate. It samples at 200Hz – that’s pretty good, but it’s not perfect. Care is needed to extract the very best from the data. In later posts I will describe how Vertigo uses a Kalman filter to improve position estimation. Essentially, with two or more data streams, drift can be impressively reduced.
Example of Position Estimate Drift
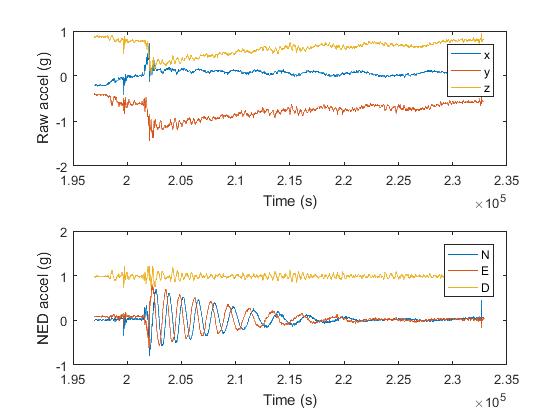
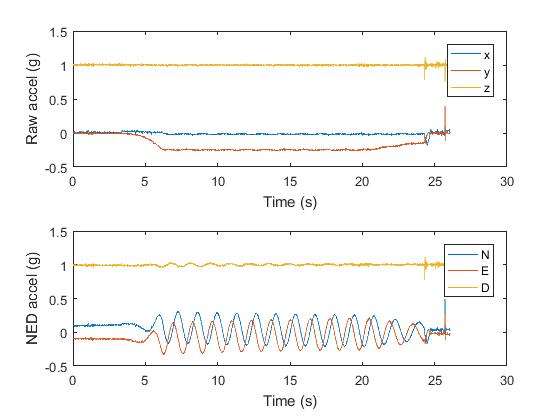
Here, Vertigo has been placed on a bike wheel and spun in a horizontal plane. Data has been recorded in the normal way.
In these first graphs, the accelerations in the board, and NED frame, can be seen. Position is then calculated using the trapezium rule.
 |
 |
|---|---|
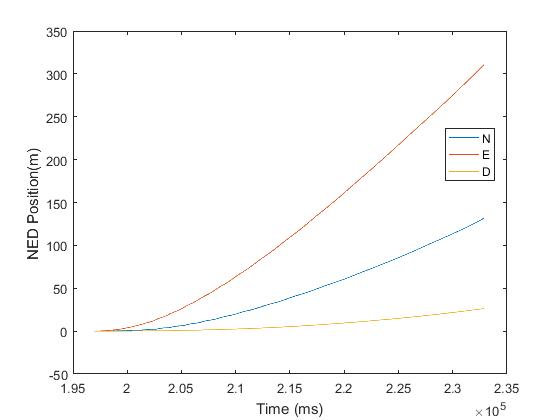
| Accelerations in board and NED frame. | Position estimates for North, East and Down |
Notice the East position, it appears to show Vertigo travelling over 300m. Vertigo was bolted to a desk! This is the result of drift.
The North direction drifted by over 100m but the information we need is within that graph. It simply cannot be seen. The first thing to do is put the data through a describable ‘high pass filter’. The major drift is removed but the smaller variations are retained. To do this, matlab is required to find the general function for the curve (the polyfit function) and remove these values (North – pvn).
        pcn = polyfit(imudata(:,1),North,10)
        pvn = polyval(pcn,imudata(:,1));
        plot (imudata(:,1), North - pvn);
The result is shown below.
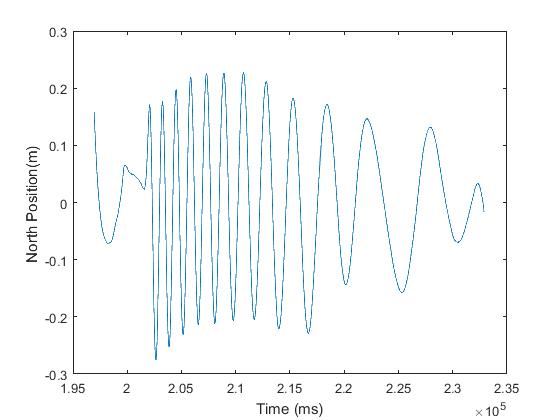
Miraculously, it is instantly possible to see the oscillatory nature of the acceleration in the North direction. The amount of movement is also much more acceptable. It is possible too to see that the frequency of the wheel begins to drop as it slows down. All very impressive. But why would the amplitude vary? Vertigo is attached to a wheel’s rim; it should have a constant amplitude…
This is where some added information can be of enormous value. In this case it is as follows – It is known that the amplitude for this wave pattern ought to be fixed. Some of the addition ‘wobble’ in the results needs to be removed. The first thing to do is home in on the section of data to be analysed. The section between 5 and 20 seconds has been chosen here. (Time reads from 0 to 15000ms)
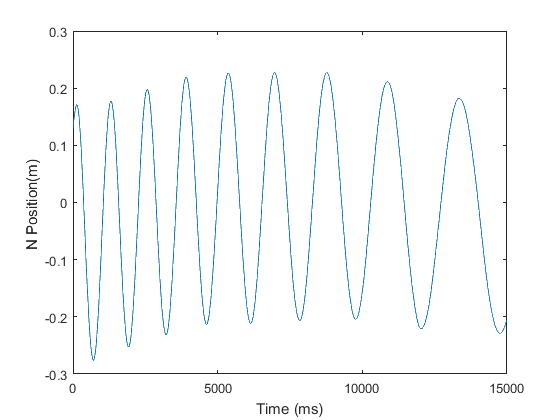
Next, the tips of the oscillations are identified using the data cursor.
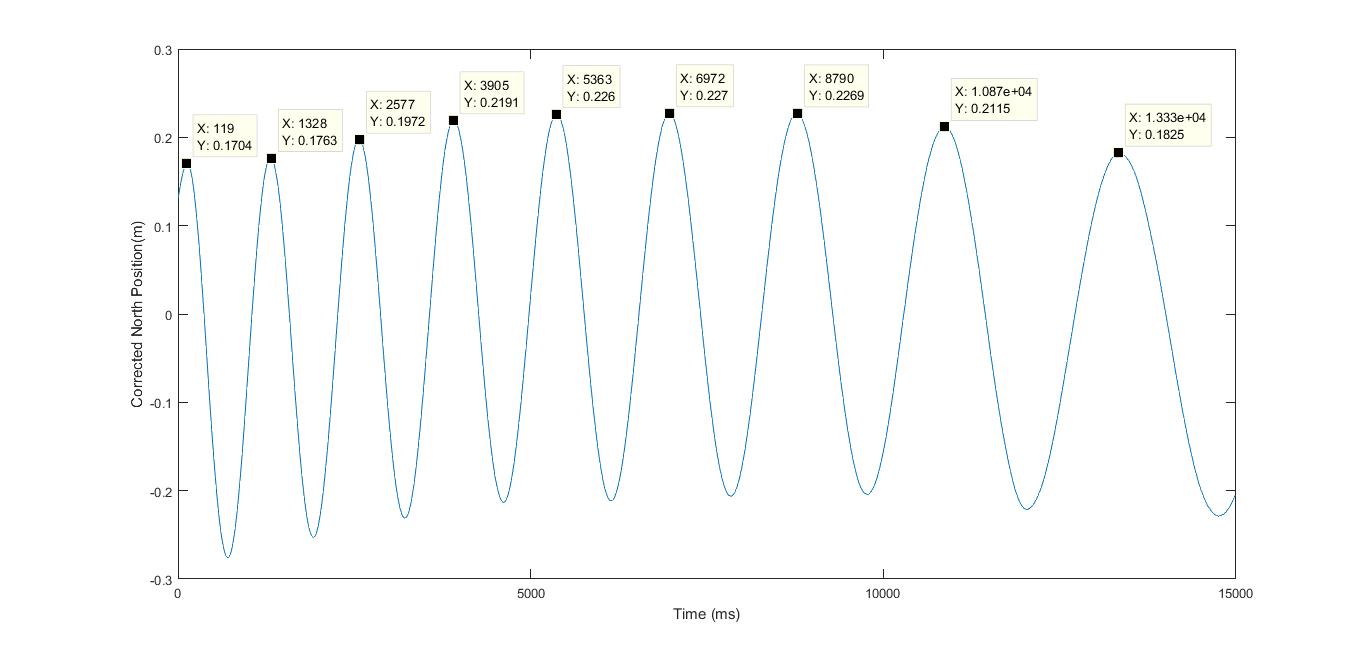
The same polyfit function, used to removing the larger drift, is used again to find a polynomial curve for the data cursor points.
The curve for these cursor points is as follows:
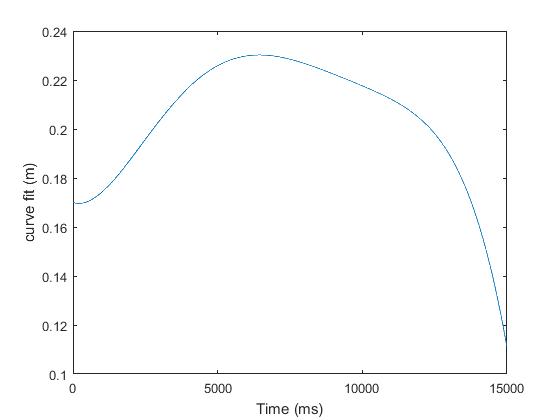
This looks rather dramatic but the scale of the graph is very small. Users can experiment to find the best possible fit by varying the polynomial order matlab uses to fit the curve. Trial and error is a reasonable method with values between 2 and 6.
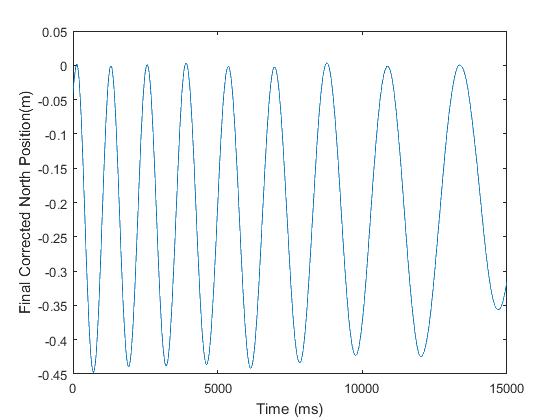
Once these values are subtracted from the oscillatory graph, the graph below is obtained. Constant amplitude and no visible drift.
Drift will naturally occur with the gyroscopes too – although more so around the Yaw axis. It can be removed in a similar way if some added information is available. An example here might be to know the orientation at the start and end of data collection. (Gyroscope drift is much easier to remove as it has a linear trend).
It should also be noted that position drift is normally accounted for with the Kalman filter. Even indoor investigations, with no GPS signal, will still use Kalman logic to avoid large global errors.
The annotated files for the activity above are here. If drift is removed from the East direction too, it is possible to plot the exact position of Vertigo on the rotating wheel.
November 2017
Pitches, Rolls, Yawns.
There has been a slight bottle neck in delivering vertigos to schools. At present, analysis requires matlab and getting this to teachers and pupils has been harder than expected. Mathworks have been very helpful and offered a free licence for a standalone machine to accompany each Vertigo. This will give an invaluable start to those schools looking forward to analysing results of their own. The laptop/ vertigo packages are being prepared as I type.
Therefore, this month then I will focus on one of IRIS’ less obvious goals – “To Enrich teachers’ careers”.
I have been teaching Physics for 20 years. In that time, I have become very familiar with the A-level specification and the kind of questions bright, enthusiastic pupils might ask. I am keenly aware of the sticking points they have in moving from a point of ‘cognitive confusion’ to understanding, but I had completely forgotten what it felt like. I’ve relearnt it. And what’s more, I found it far more enjoyable than I ever did when I was younger.
My journey this last month has taken me on a tour of quaternions and rotating frames of reference. Vertigo was not kicking out the data we needed but everyone in the team knew it was hidden on the SD card somewhere. That data mining and analysis was difficult but it was also fun. And, when I finally found the solution, deeply rewarding.
So now I know a little more about quaternions, Euler angles, intrinsic and extrinsic rotations. All of which will add very little to my day-to-day job. Except that, through this learning I have reconnected with the feeling of learning itself. I now have far more empathy with my students having positioned myself on the opposite side of the classroom, and I think it’ll make me a better teacher.
 |
 |
|---|---|
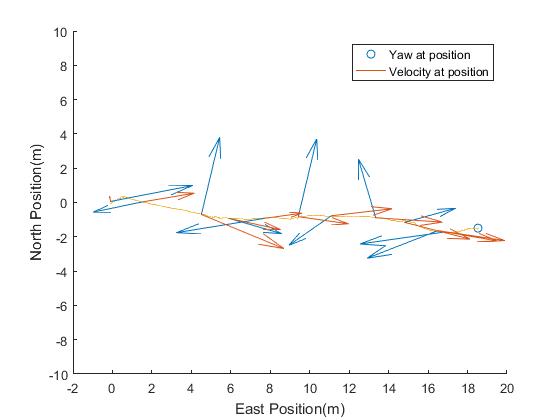
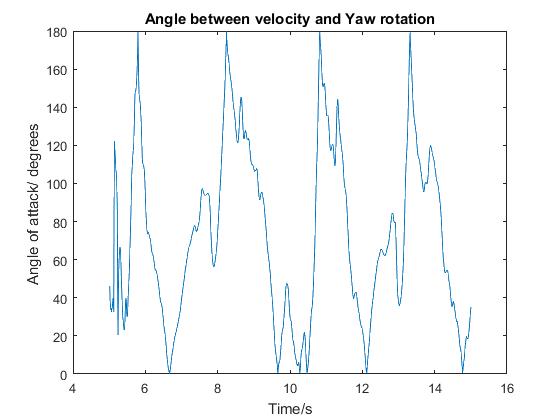
| Me explaining a rotating and world frame at IRIS symposium | My angle of attack as a rotate along a road |
It has also opened a myriad of questions for me, the proverbial can of worms. The most troubling, “why did I enjoy getting stuck and finding the work hard whilst some of my pupils don’t”. A few seem far happier when they- ‘just get it’. I have a hypotheses or two but I suspect there’s more to learn here.
Suffice to say that with the expansion of the internet since I was at university the opportunity for self-guided learning is immense. Sites such as you tube, the khan academy, Wikipedia and Hyperphysics give huge scope for knowledge acquisition. There are many less well know pages too, here’s award winning academic Jess Wade’s site- there’s enough here to keep a person busy for weeks.
So, I was I wrapping my learning around everyday life. Something had to give way and that thing was sleep. I didn’t have much free time during daylight hours and so I ate into a little bit of the night instead. As a long-term strategy, I suspect this would end in catastrophe but as a one off it was great fun. Some results
Here’s me walking down my road whilst also rotating around a vertical axis (That is a yaw in an extrinsic frame-it’s also enormously embarrassing!). The position plot is trivial. But what I have also added is my velocity vector and my Yaw angle. The second graph shows what could be described as my ‘angle of attack’. The angle between my velocity and the direction I am facing. I should add, I can now use matlab…
 |
 |
|---|---|
| Position, Velocity and Yaw | Angle of attack |
The angle of attack is important to planes and flying- that’s why it is important here. Angelo had a few problems gathering data but we’re still hopeful something can be gathered. Before then, I have started ‘flight club’ at school. I’ll be welcoming students from St Philomena’s, Wallington Girls as well as from my own school. As with all my classes- first rule- learning is fun.

October 2017
Vertigo travels to Thorpe Park, Young Scientists Journal Conference and Southampton University
The Young Scientists Journal is the world’s only peer-reviewed scientific journal for students. With an enormous online readership, huge kudos is available if your work is accepted by the editors. It would be wonderful to see a Vertigo team have an article published.

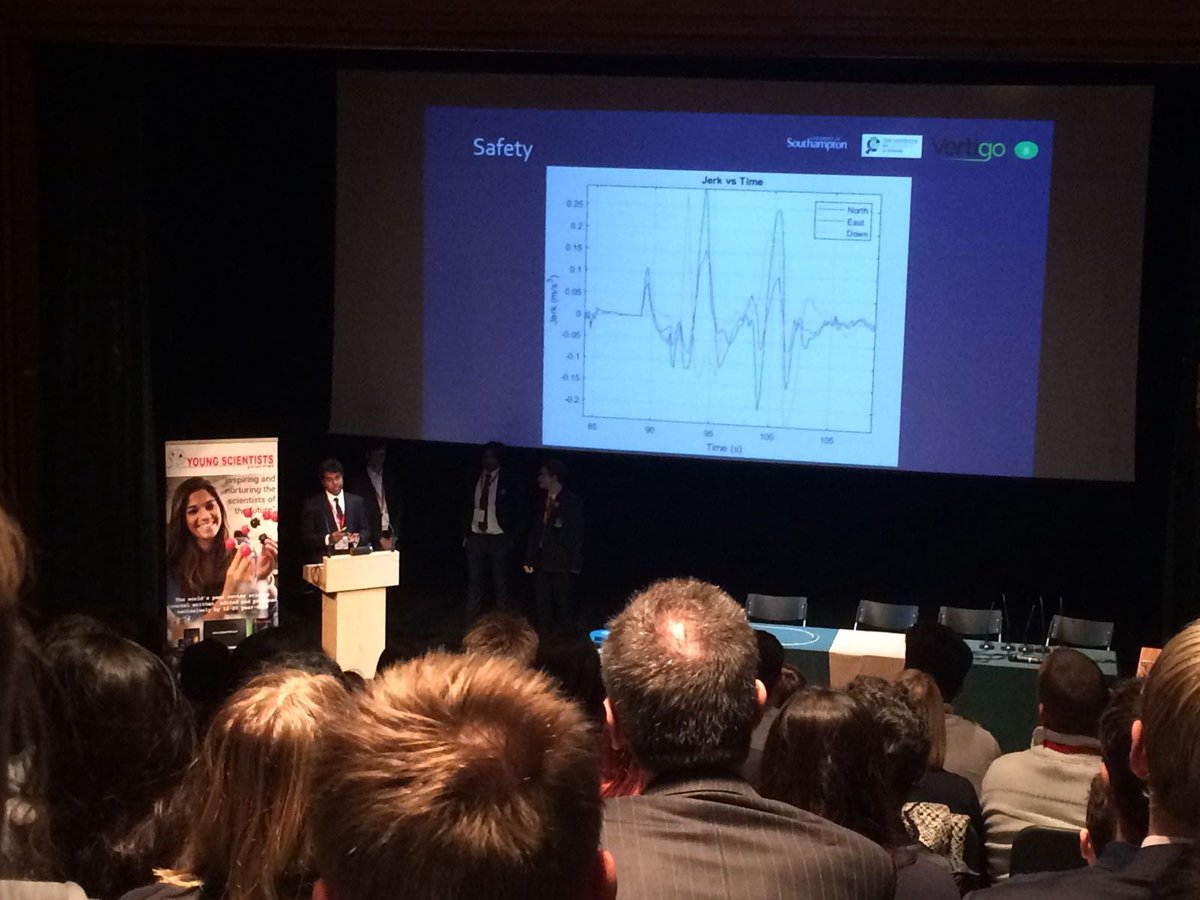
On October 12th a small cohort of pupils presented their Vertigo work to delegates at the annual conference. A daunting prospect, explaining some pretty tricky science to an audience of over two hundred, at one of the most prestigious universities in the world. Still, IRIS projects help students engage in science but also help develop the softer skills needed to be the exceptional scientists and engineers of the future- communication is key.
To spice things up a little, the pupils rushed off to Thorpe Park the weekend before and took some data on rides therein. Here are some results.
 |
 |
|---|---|
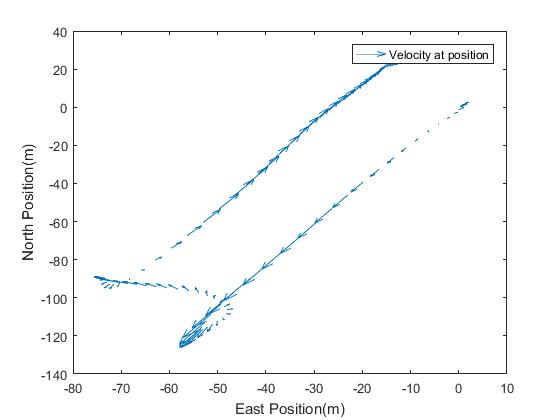
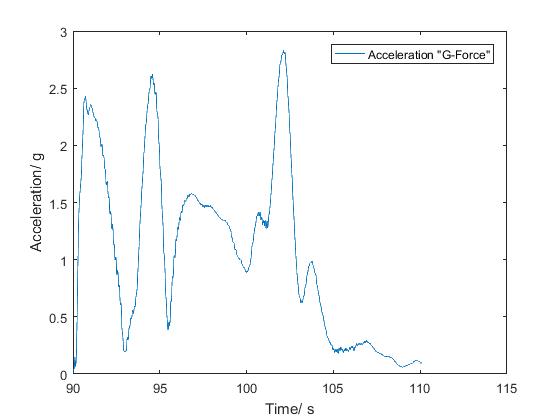
| Velocity ‘Quiver’ plot on Stealth | Maximum acceleration on Stealth |
Impressive accelerations. Notice, there are three sections on the ride giving thrill seekers maximum ‘g’. Yet, only one of these involves a change in speed. Some great school Physics for sure. No doubt a year 10 class would love to learn the correct definition of acceleration at a theme park!
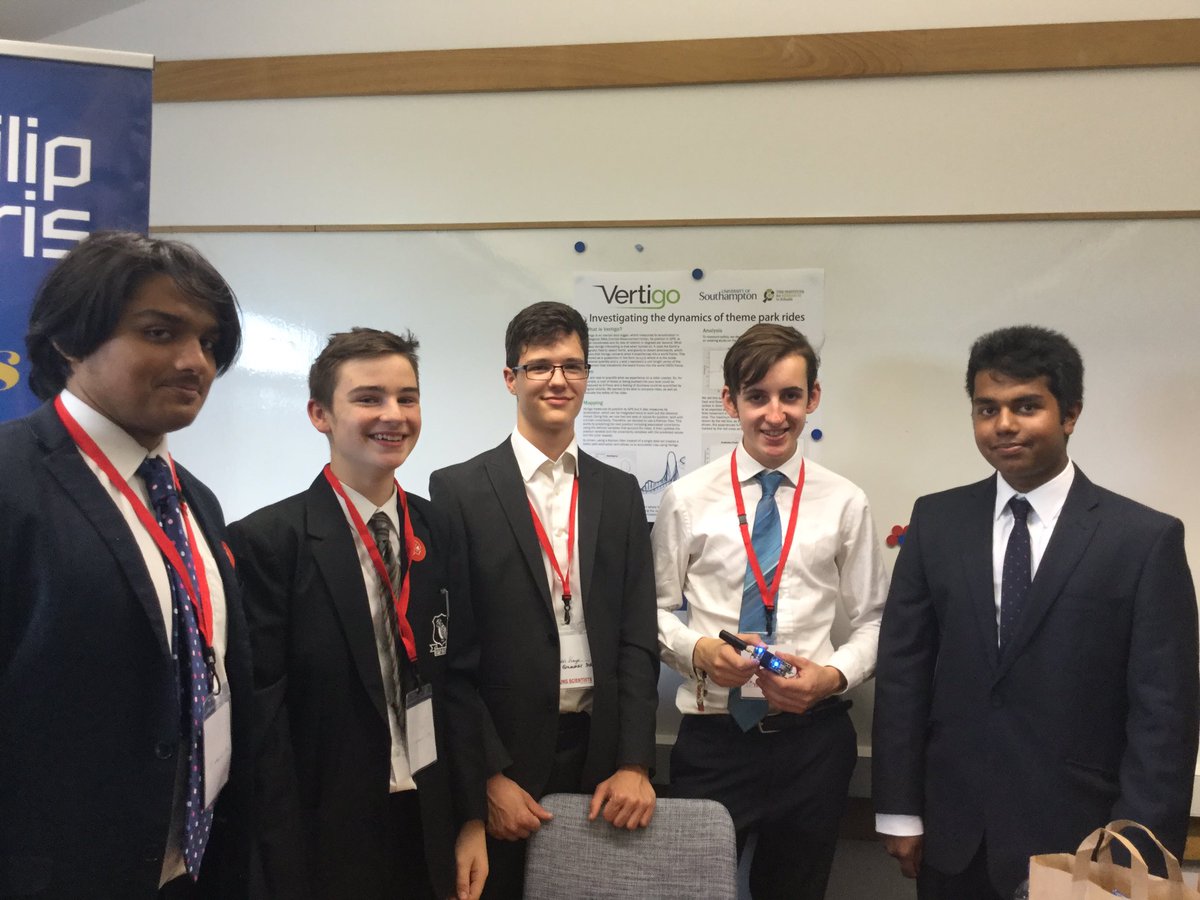
The team did brilliantly winning runner up in the poster competition. Well done all.
 |
 |
|---|---|
| Vertigo team present in Queen’s College | Vertigo team with runner-up poster |
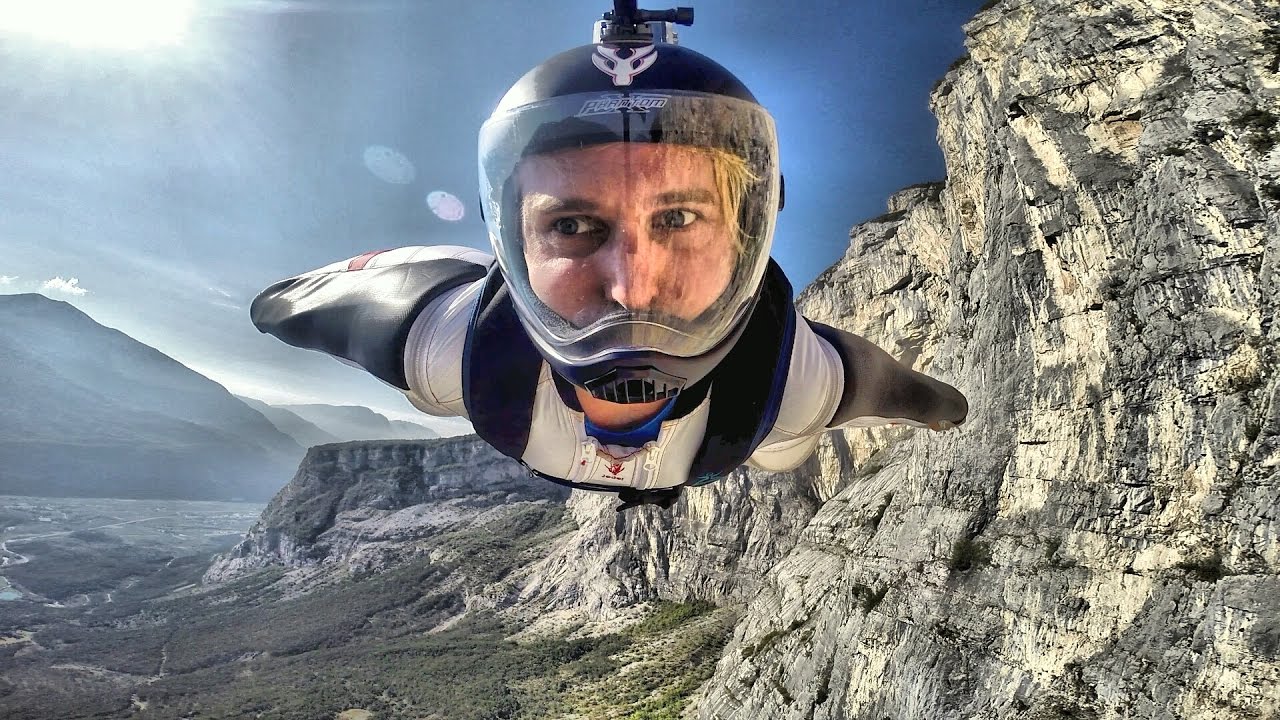
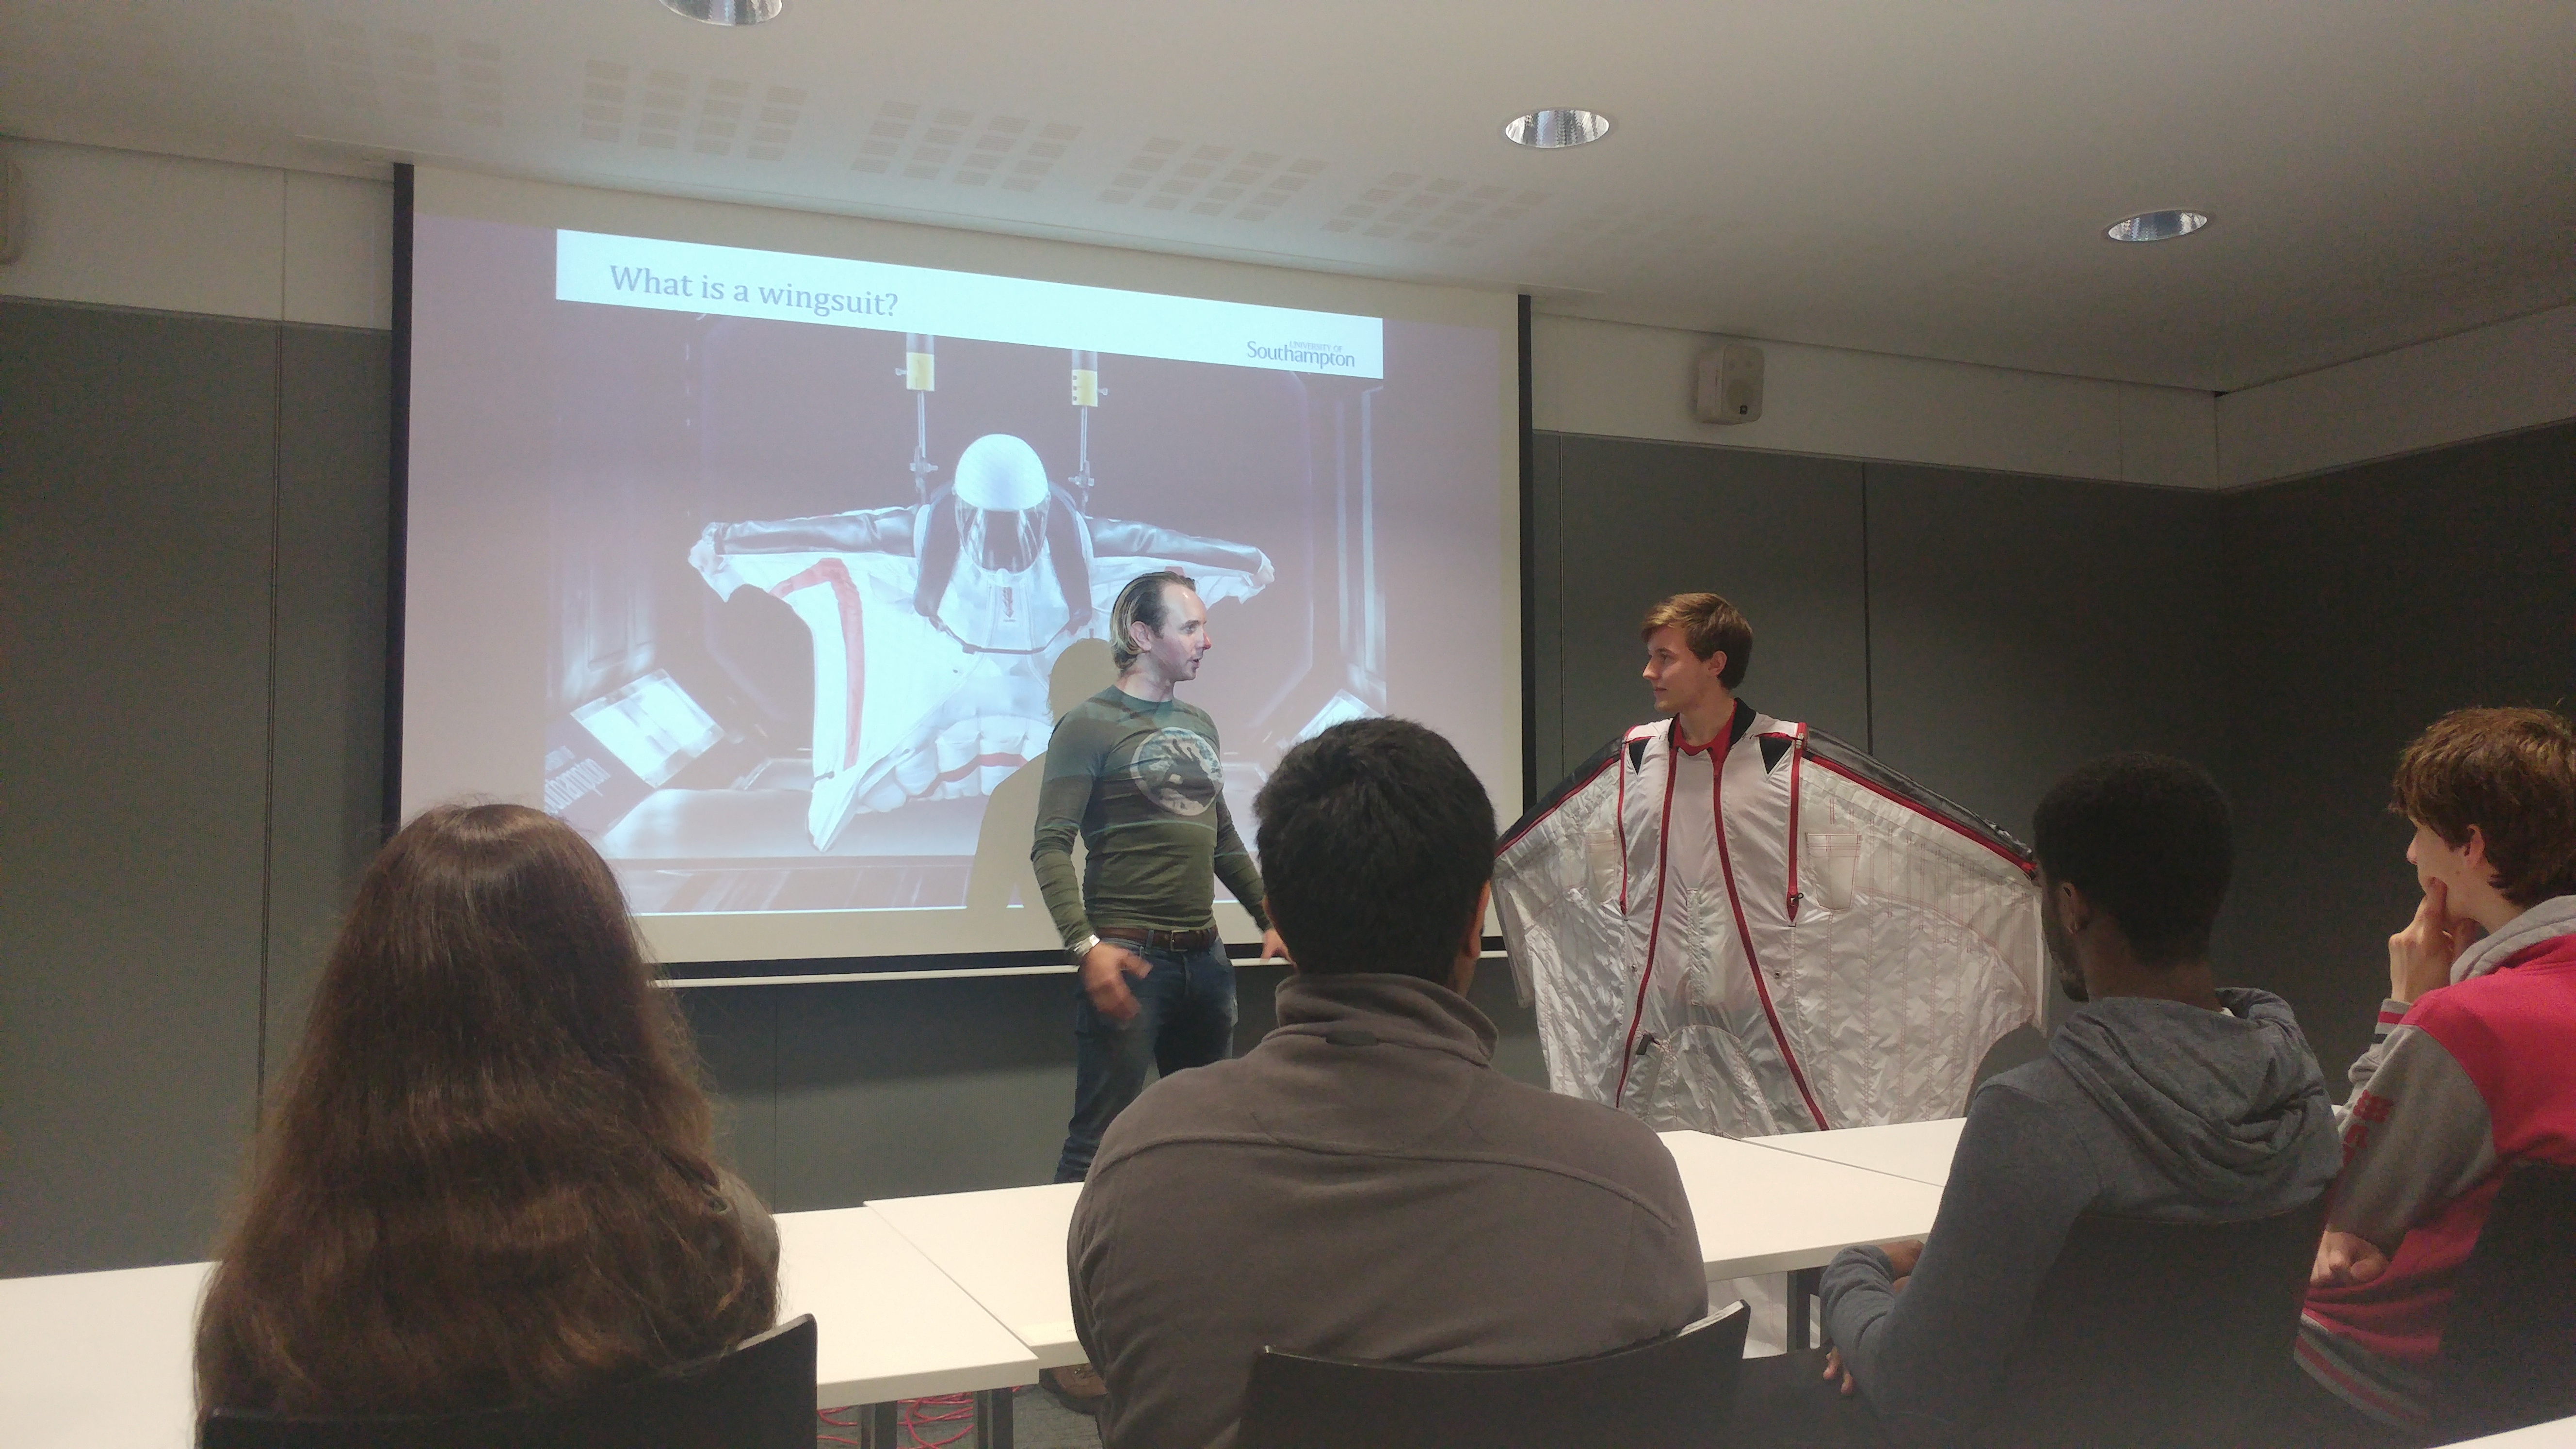
Wing Suit Flying
There’s plenty of anecdotal research that suggests that pupils like the idea of going into engineering as a career to improve the quality of peoples’ lives. And why not? After all, what a wonderful feeling to know your work has helped others. Sometimes that work might even go into life-saving and it seems Vertigo might have that opportunity.
Wing Suit flying is an incredibly dangerous activity. Clearly, it is very enjoyable too. Sadly, some quite exceptional people have died whilst pushing forward the limits of their sport and some of these people had been friends of Angelo Grubisic’s.
The problem appears to be that wing suits stall – (their performance dramatically deteriorates as the flier’s ‘angle of attack’ gets to be too high). Angelo explained all to the pupils and furnished them with some data and understanding which will be of enormous help to them in the coming weeks.
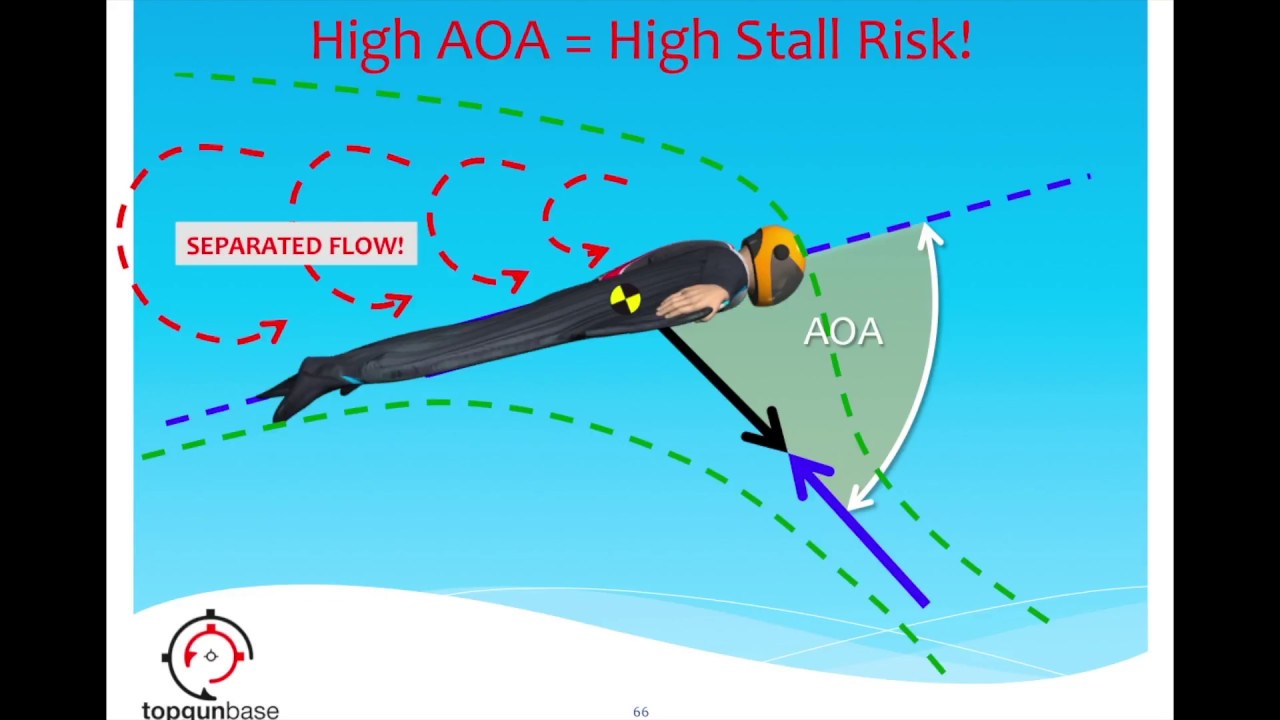
Vertigo is able to measure this angle of attack. It’s not completely straight forward and pupils will need to brush up on their vector calculus (- the dot product has a use beyond our maths textbooks!) but it’s very achievable given a little dedication. Fingers crossed we can add something.
Flying at the international wing suit championships in America- Vertigo will have data from Angelo soon. Watch this space. Good Luck Angelo
September 2017
The new academic year begins.
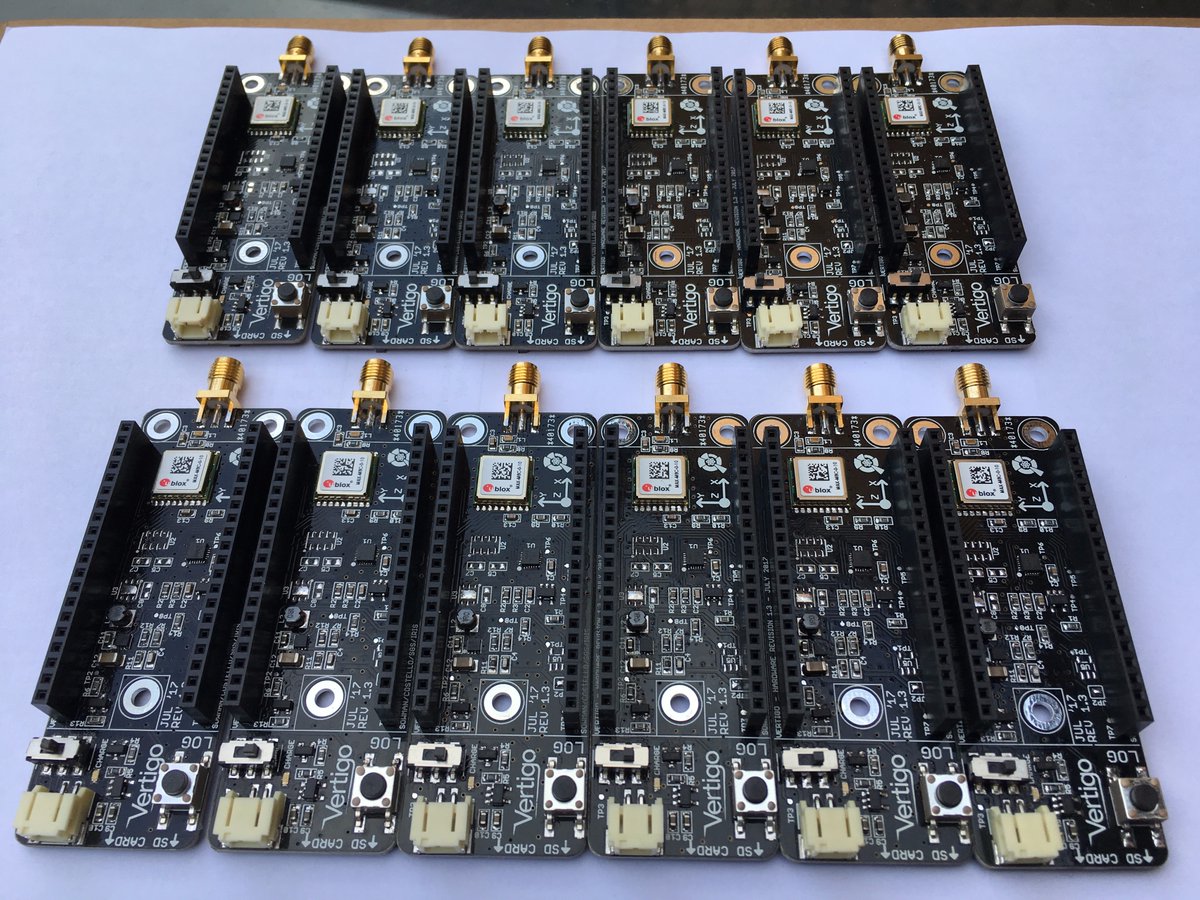
Working tirelessly over the summer JonSowman has produce twelve awesome Vertigos. One for him, ten for schools and one for me. Overcoming a slight mishap at his local post office, the units are ready to ship out to our excited schools.
At present, three schools, beyond the Sutton IRIS hub, have started the journey to Vertigo data analysis. This involves installing matlab and reviewing a few test files. Not a completely trivial exercise. So, taking Jon’s lead, I developed a webpage to lead schools through, step by step, the nuances of matlab’s graph plotting functions. Results from our own preliminary experiments have been very encouraging. Vertigo continues to amaze all those who have seen it in action.
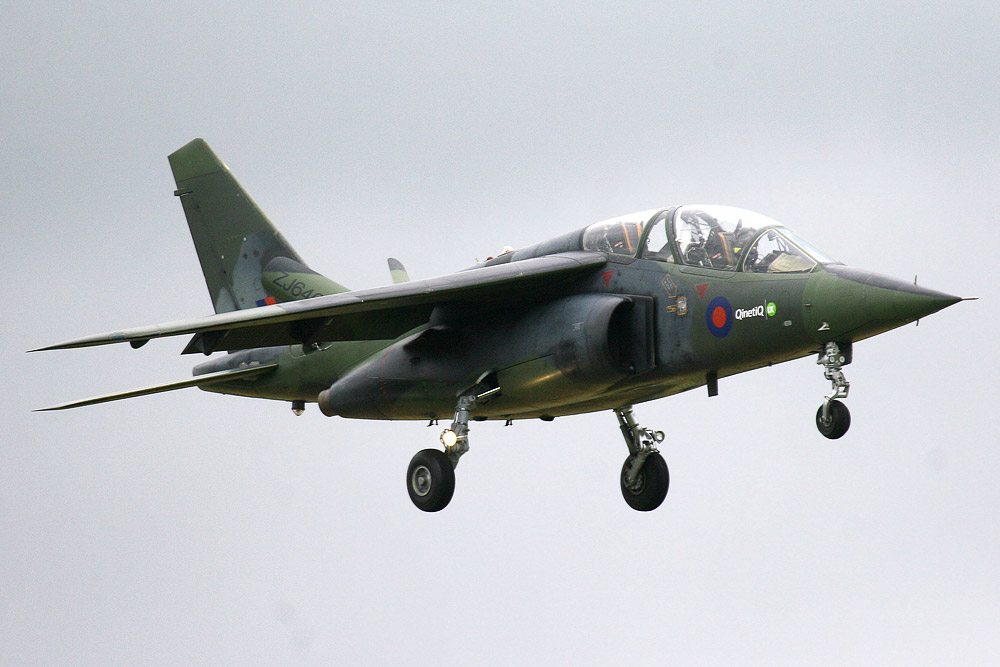
The webpage has proved successful with other schools and they are now ready to take their own data files. In particular, Cokethorpe school have strong links with the RAF at Brize Norton. Could they get a Vertigo on an RAF plane?
 |
|
|---|---|
| Vertigo on a jet? | Dr Grubisic |
Here, we are eagerly waiting for data files to come through from Dr Angelo Grubisic of Southampton University and the Icarus project. Angelo, took a vertigo out on one of his wing-suit flights and is keen for pupils to delve into this data for one key variable. More on this in next month’s instalment.
We also have pupils heading off to Thorpe Park for a second round of data acquisition. The Colossus looks to be the ride of choice for data taking. Results will be published for the first time at the Young Scientists Journal conference in Oxford on 12TH October.
 |
 |
|---|---|
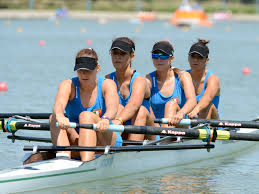
| Colossus Thorpe park | Rowers improve the ‘catch’. |
Promising links have also been developed with Oriel College at Oxford where their rowing team may be interested in a school looking into some data for them- any advantage over the competition.
Other sporting suggestions continue to roll in. One person recently suggested we contact British pair, Penny Coomes and Nick Bucklan, who, just last week, won their place at the Winter Olympics in South Korea 2018 . Vertigo on the leg of a skater completing a triple salchow would be quite something. I am looking for schools to Volunteer.